
Average Call Duration: How to Calculate and Read It
Average call duration is the total time spent on calls divided by the number of calls counted. Check whether your tool counts answered calls only, then read the median beside it.

By Tej Pandya, Founder · Updated 10 Oct 2026

Key takeaways
- 01Average call duration equals total call time divided by the calls counted. Write down whether your report counts answered calls only or every dial, because that choice can more than halve the figure.
- 02The median (the middle call when you line them up by length) shows what a typical call looks like. When the average is far above the median, a few long calls are hiding many short ones.
- 03Compare by call type (cold, follow-up, inbound) and against your own past weeks. Another business's average tells you little about your calls.
- 04Short is not bad and long is not good. Judge duration next to the outcome recorded for each call.
In this article
- 1What is average call duration, and how do you calculate it?
- 2Which calls should average call duration include?
- 3Why can a high average call duration hide mostly short calls?
- 4How do you test your own call duration data in five checks?
- 5How many dials does an hour of talk time take?
- 6What should you do when your average call duration looks wrong?
- 7How do we report average call duration at TalkEasy?
- 8Frequently asked questions
A caller makes 120 dials in a day. Forty-eight are answered, and 120 minutes go on those conversations. Her report can honestly show an average of 2.5 minutes or of 1.0 minute, and her calls are identical in both cases. Only the counting rule differs.
The mix of calls shifts the figure just as much. A team that spends one week following up people who asked for a quote and the next week cold calling strangers will see the average fall in week two, even though nobody's calling has got worse. A manager who reads that drop as lost effort coaches the wrong thing.
The average also hides its own shape. A few 15-minute conversations can lift it above what most of your calls look like, so a team full of abrupt hang-ups can still report a respectable number. Reading it well means knowing what it counts, what it blends and what it conceals.
What is average call duration, and how do you calculate it?
Average call duration is the total time on calls divided by the number of calls counted. If a team spends 250 minutes on 50 calls, the average is 5 minutes. The formula is simple. The trouble is that several different measures share the name and its abbreviation.
| Term | What it measures |
|---|---|
| Average call duration (ACD) | Total time on calls divided by the calls counted. Carriers usually count answered calls only |
| Average talk time | Conversation only, with hold time left out |
| Average handle time (AHT) | Talk time plus hold time plus after-call work such as notes and forms |
| Answer-seizure ratio (ASR) | The share of call seizures (calls the network set up) that were answered, used by carriers |
| Automatic Call Distributor | The system that routes incoming calls, also shortened to ACD |
If you came from a telecom or VoIP (internet calling) background, the carrier-side measures are defined in the ITU's Recommendation E.425 on internal automatic observations, which covers ASR alongside related ratios. Those measure network routes. For a sales or support team, the questions below matter more.
Which calls should average call duration include?
Count answered calls only if you want to know how long conversations last. Count every dial if you want to know how much talk time each dial yields. Both are valid, but never compare one with the other.
Here is a worked example, our own illustration with round numbers. A caller makes 120 dials in a day. 48 are answered, so the answer rate is 48 ÷ 120 = 40%. Total time on the 48 answered calls is 120 minutes.
- Answered calls only: 120 ÷ 48 = 2.5 minutes.
- Every dial: 120 ÷ 120 = 1.0 minute.
Same day, same calls, and the figure moves from 2.5 minutes to 1 minute. Before you read any trend, find out which version your report uses. Many dashboards do not state which version they show, so check yours. Also check whether voicemail and calls that rang out for a few seconds are included, since they pull the number down.
Why can a high average call duration hide mostly short calls?
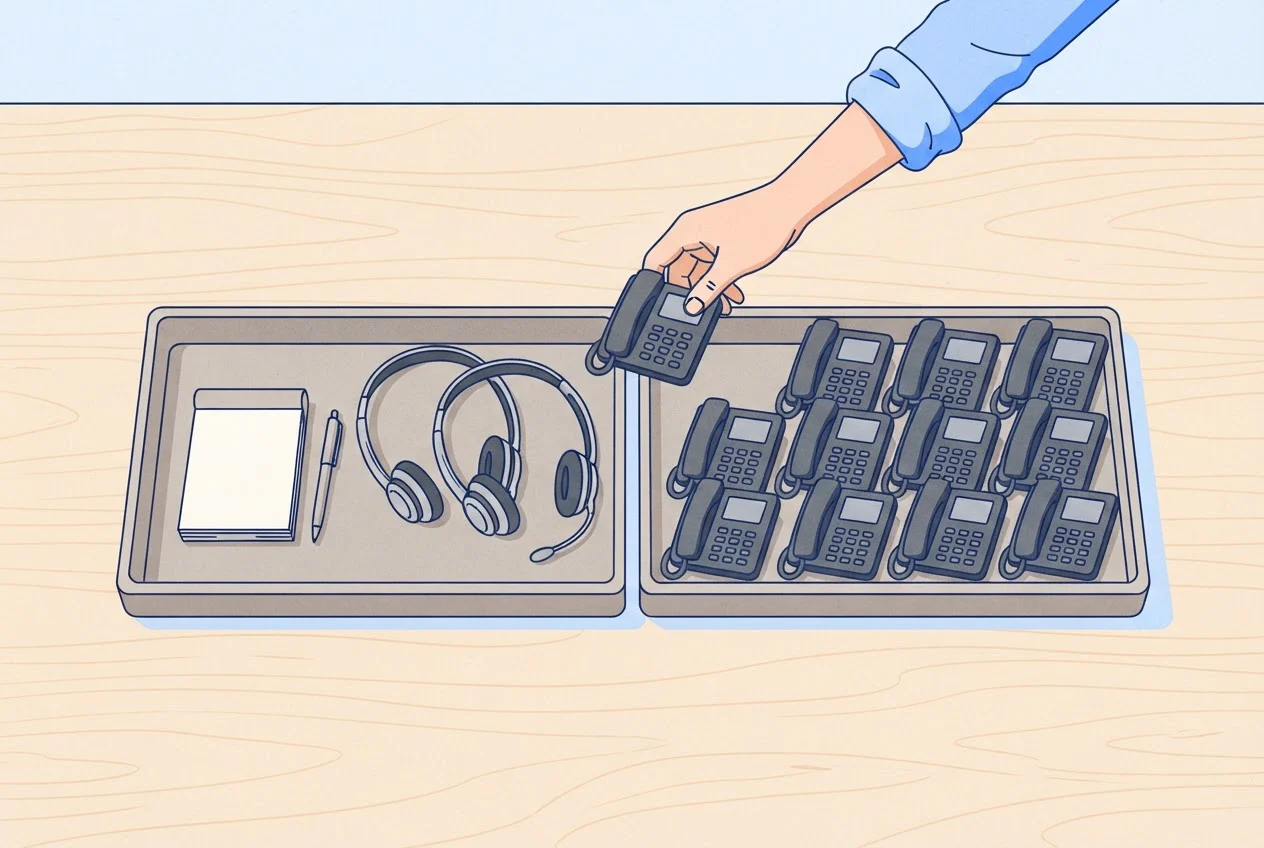
A high average call duration can hide mostly short calls because call lengths are skewed: a few very long calls add far more minutes than many short ones take away. The median shows what a typical call looks like, and the average alone cannot.
Here is a constructed example of ten answered calls, in seconds: 15, 20, 25, 30, 40, 45, 60, 90, 420 and 900.
- Total: 1,645 seconds, so the mean (the ordinary average) is 164.5 seconds, about 2 minutes 45 seconds.
- Median: the 5th and 6th calls are 40 and 45 seconds, so the median is 42.5 seconds.
- Calls under 30 seconds: 3 of 10, or 30%.
- Time in the two longest calls: 1,320 of 1,645 seconds, about 80%.
The dashboard would show a comfortable 2 minutes 45 seconds. Yet most calls ended in under a minute, and two calls supplied four-fifths of the talk time.
Real call data behaves this way. A 2010 study of 263.6 million calls by 3.1 million subscribers of one city's mobile operator, by Vaz de Melo, Akoglu, Faloutsos and Loureiro, covered one month of consumer calls, not sales calls. It found that a skewed, long-tailed model fitted more than 96% of users' call lengths better than exponential or lognormal models. Business calls are likely to be skewed in the same way, but that is our inference, so check it against your own median. We always read the median and the share of very short calls next to the average.

How do you test your own call duration data in five checks?
Run five checks on last week's call list, in this order. Each has a pass and a fail. The thresholds in checks 2, 3 and 5 are our recommended starting points, not industry benchmarks; adjust them after a month of your own data.
| # | Check | How to run it | Pass | Fail, then do this |
|---|---|---|---|---|
| 1 | Which calls are counted? | Find the definition in your report, or recompute from 10 calls with a calculator | You can state "answered only" or "all dials" | You can't. Don't compare any trend until you can |
| 2 | Mean against median | Copy the call durations into a spreadsheet and use its MEDIAN function | Mean is under 1.5 times the median | Mean is 1.5 times the median or more. Listen to the 3 longest and 3 shortest calls |
| 3 | Share of very short calls | Count answered cold calls under 30 seconds, divide by all answered cold calls | 33% or fewer end under 30 seconds | More than 33%. Review 10 of them (see the table below) |
| 4 | Outcome on long calls | Take calls longer than twice the median and check each has an outcome recorded | Every one has one | Any without. Fix the habit before judging the call |
| 5 | Trend by call type | Split cold, follow-up and inbound; compare each type's average this week with its own four-week average | This week is within 20% of the four-week average for that type | Outside 20%. Look at what changed that week |
Never put cold calls, follow-ups and inbound enquiries into one number. A first call to a stranger and a call to someone who asked for a quote are different jobs, and a blended average will change whenever the mix changes, even if nobody's calling improves.
How many dials does an hour of talk time take?
An hour of talk time takes 60 ÷ (answer rate × average answered call in minutes) dials. This is our model, and the inputs are yours. With a 40% answer rate and a 2.5-minute average, that is 60 ÷ (0.40 × 2.5) = 60 dials. With a 30% answer rate and a 1.5-minute average, it is 60 ÷ (0.30 × 1.5) = 60 ÷ 0.45, about 133 dials.
This is the number to put in front of a team that complains about targets. A drop in answer rate or in call length raises the dials needed for the same talk time, without anyone working less hard. It also tells you whether to fix the list, the timing or the opening, rather than only asking for more dials. Our cold-call opening lines page covers what to test in the first ten seconds.
What should you do when your average call duration looks wrong?
Fix the cause the pattern points to, not the number. Pushing callers to talk longer or shorter changes the metric and nothing else. Start with this table.
| What you see | Likely cause | First action |
|---|---|---|
| Many answered outbound calls under 30 seconds | The opening loses people, or the caller's number looks like spam | Listen to the 10 shortest. Test a new opening. Check for a spam label on your number |
| Mean far above median | A few unusually long calls | Listen to the longest. Decide whether they are real sales conversations or stuck calls |
| Long calls with no outcome | Calls end without a result being recorded | Require a call disposition after every call longer than twice the median |
| Short inbound calls | Often fine: the caller wanted an address, a timing or a price | Check that the calls were answered, because missed inbound calls cost more than short ones |
| Average falls when a new caller joins | Different script or habits | Compare callers in a weekly team call report and listen to their recordings |
A short call can be a success and a long call a failure. A buyer who asks for a price and a visit time and hangs up has had a good call. A 20-minute call that ends with "I'll think about it" and no next step has not.
How do we report average call duration at TalkEasy?
Our Call Analytics reports total calls, answer rate, missed calls, average talk-time, team performance and peak calling hours. Reports come daily or monthly and can be downloaded for sharing or offline analysis. Use the answer rate and average talk-time as your starting point for checks 1 and 5 above.
Our Business Dialer logs and records calls, so you can listen to your shortest and longest calls rather than guess at them.
As of October 2026, TalkEasy Pro costs ₹999 + GST a month with three talktime hours a day, and extra talktime is ₹49 + GST an hour. Enterprise is quoted on request. You can cancel anytime. Run the five checks on your last week of calls first, then Talk to Our Expert if you want help reading the result.
Read your call data with TalkEasy Call Analytics
Frequently asked questions
TRAI's yearly report gives minutes of usage per subscriber per month (950 in 2025-26), a measure of total usage, not of single calls. For your own team, the typical call is the median of your answered calls, so calculate that from your call list.
Sources
- 1.TRAI, The Indian Telecom Services Yearly Performance Indicators 2025-26 (published 5 October 2026)
- 2.ITU-T Recommendation E.425, Internal automatic observations
- 3.Vaz de Melo, Akoglu, Faloutsos and Loureiro, Surprising Patterns for the Call Duration Distribution of Mobile Phone Users (ECML PKDD 2010, Springer)
- 4.TalkEasy Call Analytics
- 5.TalkEasy Business Dialer
- 6.TalkEasy pricing for India, as of October 2026