
Call Abandonment Rate: How to Count It on a Small Phone Line
Call abandonment rate is the share of incoming calls where the caller hangs up before anyone answers. On a small line the figure swings with your counting rules, so fix them first.

By Tej Pandya, Founder · Updated 24 Oct 2026
Key takeaways
- Call abandonment rate is abandoned calls ÷ offered calls × 100. A rate means little until the counting rule (what counts as offered, and the short-call cut-off) is written next to it.
- In our worked example, the same 300 calls give 32.0%, 29.2% or 24.4% depending on whether you remove no short calls, calls under 5 seconds, or calls under 10 seconds.
- Published targets come from queued contact centres, so compare your line with its own earlier weeks.
- A weekly average hides the hours that hurt. Split the count by hour and fix the worst two-hour block first.
In this article
- 1What is call abandonment rate, and what counts as an abandoned call on a small line?
- 2Why can one week of calls give a 32%, 29% or 24% abandonment rate?
- 3What is a good call abandonment rate for a small business line?
- 4How do you calculate your own abandoned call percentage in 7 days?
- 5What should you change once the 7-day count shows where callers give up?
- 6How do we help you count and cut unanswered calls?
- 7Frequently asked questions
Ask three people what counts as an abandoned call and you get three answers: drop every caller who hung up within five seconds, drop those within ten, or count every call nobody answered. On a sample week of 300 calls (made-up figures, worked through below), those rules move the result by 7.6 points.
Most published advice on the metric was written for contact centres with queues, hold music and a team of agents. A clinic, shop, agency or sales team in India usually has none of that. The phone rings, nobody picks up, and the caller tries someone else.
The rate still matters on such a line, but the textbook benchmarks were not measured on it. This page gives the formula, shows what each counting rule does to it, sets out what published figures can and cannot tell you, and ends with a 7-day sheet you can fill in from your own call log.
What is call abandonment rate, and what counts as an abandoned call on a small line?
Call abandonment rate is abandoned calls divided by offered calls, multiplied by 100. An abandoned call is an incoming call the caller ends before a person answers. Offered calls are all incoming calls that reached your number. On a small line, we treat every unanswered call (one that rings out, or ends at voicemail with nobody speaking to the caller) as abandoned, and use "unanswered" for that count throughout.
Contact centres built the metric for queues. Callers wait in line, often after an IVR (interactive voice response, the "press 1 for sales" menu), and leaving the queue is the abandonment. A small line usually has no queue. The caller hears ringing and gives up. The arithmetic is the same, but the rate on such a line is not comparable with contact-centre targets.
Answer rate (answered calls ÷ incoming calls × 100) is the same count seen from the other side. Our guide to tracking your sales team's calls gives its formula and the five other numbers worth reporting weekly. Abandonment rate adds one step: it removes very short calls first, which the next section covers.
In outbound dialling the phrase means something else: a call the dialling software placed that no agent was free to take. The UK regulator Ofcom has given no safe level of such calls since 1 March 2017 (Call Centre Helper). This page covers inbound calls only.
Why can one week of calls give a 32%, 29% or 24% abandonment rate?
In an example week, the three rates differ because each treats short calls differently. Short abandons are calls that end within a few seconds, and many teams remove them from both sides of the sum. Where you set that cut-off changes the answer by several points, as the worked example below shows.
Published cut-offs run from 5 seconds (Call Centre Helper) and 5 to 20 seconds (TechTarget) to 10 seconds (ACXPA) and 10 or 30 seconds (MetricNet). None is the standard.
Worked example (made-up inputs, our calculation). A small line receives 300 calls in a week. 204 are answered and 96 are not. Of the 96 unanswered calls, 12 lasted under 5 seconds and 30 lasted under 10 seconds. With a cut-off, the formula is (unanswered − short) ÷ (offered − short) × 100, the form TechTarget gives for a 5-second cut-off.
| Counting rule | Working | Rate |
|---|---|---|
| No cut-off (every unanswered call) | 96 ÷ 300 | 32.0% |
| Remove calls under 5 seconds from both sides | (96 − 12) ÷ (300 − 12) = 84 ÷ 288 | 29.2% |
| Remove calls under 10 seconds from both sides | (96 − 30) ÷ (300 − 30) = 66 ÷ 270 | 24.4% |
The 7.6-point gap (32.0 − 24.4) comes from the rule alone. No caller behaved differently. Compare weeks only under one written rule.
What is a good call abandonment rate for a small business line?
Published targets come from contact centres, so the sound target for a small business line is your own earlier weeks. For queued contact centres, the Australian Customer Experience Professionals Association (ACXPA) puts the 2024 average for voice at 8%. It adds that a rate only means something beside a service level, the share of calls answered within a set time.
ACXPA says 5% at a 90/20 service level (90% of calls answered within 20 seconds) suggests a well-run centre, while 5% at 70/60 (70% within 60 seconds) suggests a service-level problem hidden by callbacks, channel deflection or measurement choices.
Context changes the target. In a practitioner thread from 2008 (a contact-centre discussion, so dated and not about small lines), one commenter uses a 1.8% target. Another adds: "A sales center needs to grab every single call that comes in. A service center can be a little more lax."
For small lines, one US study gives a rough picture. In 2016 the marketing firm 411 Locals monitored 85 businesses in 58 industries for 30 days. It recorded 37.8% of calls answered, 37.8% sent to voicemail and 24.3% with no response. The sample is small, old and American, so treat it as an illustration that small lines can look nothing like a contact-centre target.
India's regulator measures speed, not abandonment. The Telecom Regulatory Authority of India (TRAI) sets a benchmark of at least 95% of calls answered by the operator (voice to voice) within 90 seconds for telecom customer care (TRAI performance indicators, January to March 2026, released 22 June 2026). That measures answer speed on telecom helplines, not abandonment on a business line, so it is not a target for your line.
Our recommendation: set the first target against your own week, not against a published figure. Bring your worst two-hour block down to the rate of the rest of the day. Set a ceiling for the whole week only once you have four weeks of your own data.
How do you calculate your own abandoned call percentage in 7 days?
Write your counting rules first, then count offered, answered and short unanswered calls for seven days and work out two rates, raw and adjusted. Each step below has a pass or fail test you can check yourself.
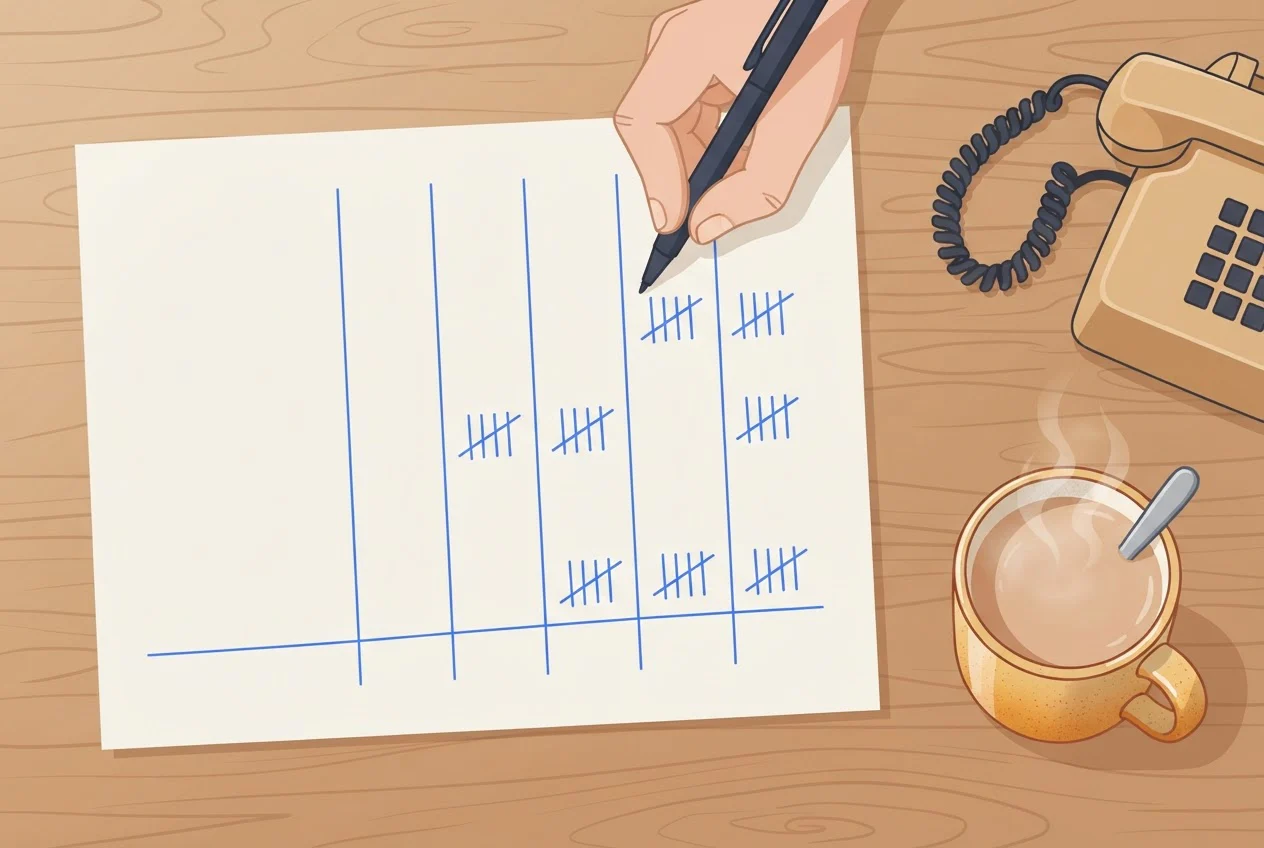
- Write the rules on one pageDefine offered (every incoming call that reached your number), unanswered (nobody spoke to the caller), a cut-off and a redial rule. Our recommendation: use 10 seconds only as the adjusted figure, because ACXPA reports it as the most common setting. We have no data showing that sub-10-second calls on small lines are misdials, so keep the raw rate beside it as the headline. Redial rule: if the same number rings again within 10 minutes (our assumption, not a published figure) and the second call is answered, count the pair as one answered call by subtracting 1 from both Offered and Unanswered for each pair. Pass: the rules are written before you see any numbers. Fail: you change the cut-off after seeing the result.
- Collect seven days of incoming callsYou need the time, whether it was answered and how long each unanswered call lasted. Pass: every day has a call list. If your log does not show how long unanswered calls lasted, report the raw rate only and say so beside it.
- Fill in one row per dayPass: Answered + Unanswered = Offered on every row. Fail: any row where they differ.
- Work out both rates from the weekly totalsRaw = Unanswered ÷ Offered × 100. Adjusted = (Unanswered − Under 10 s) ÷ (Offered − Under 10 s) × 100. Pass: you added the seven days first, then divided. Fail: you averaged seven daily percentages.
- Split one day's calls by hour and find the worst two-hour blockPass: you can name the block and its rate.
- Change one thing, then repeat for the next seven days under the same rulesPass: only one change between the two weeks.
| Day | Offered | Answered | Unanswered | Unanswered under 10 s | Raw rate | Adjusted rate |
|---|---|---|---|---|---|---|
| Mon | ||||||
| Tue | ||||||
| Wed | ||||||
| Thu | ||||||
| Fri | ||||||
| Sat | ||||||
| Sun | ||||||
Week (totals) |
Why the hourly split matters (same made-up week, our calculation). Of the 300 calls, 84 arrived between 11am and 1pm and 42 of them went unanswered. The other 216 calls had 54 unanswered. The raw rates are 42 ÷ 84 = 50.0% in the busiest block and 54 ÷ 216 = 25.0% for the rest of the day. The week's 32.0% (96 ÷ 300) hides that half the callers in that block never reached anyone.
What should you change once the 7-day count shows where callers give up?
Match the pattern in your sheet to its most likely cause, change one thing and recount. The table gives our reading of each pattern and a first change.
| What the sheet shows | Likely cause | First change |
|---|---|---|
| Raw rate far above adjusted rate | Many calls end under 10 seconds, possibly wrong numbers or quick redials (an assumption to check) | Check whether the same numbers ring again; apply the redial rule above before changing anything else |
| One two-hour block far above the rest of the day | Too few people on the phone at that hour | Let whoever is free pick up, and move breaks out of the block |
| Unanswered calls cluster outside opening hours | Nobody covers the line | See after-hours call answering in India for costs and a 7-night test |
| High all day, spread evenly | One person or one handset carries the line | Spread the calls across the team and add automatic callback |
| Callers reach nobody and nobody rings back | Missed calls are not followed up | Use the missed-call scorecard to track callbacks and recovery |
How do we help you count and cut unanswered calls?
Our Sales Call Analytics reports Total Calls, Answer Rate, Missed Calls, Average Talk-Time and Peak Calling Hours, in daily and monthly reports you can download. It gives you daily Total Calls, Answer Rate and Missed Calls for the raw rate in steps 3 and 4, and Peak Calling Hours as a guide to which hours to examine. For the adjusted rate and the hourly unanswered split, use the call list you export or fill in by hand.
To cut the unanswered share, Missed Call Automation works on one rule: if your team misses a call, we automatically call the customer back. Our AI receptionist answers incoming calls, collects names, numbers and requirements, transfers qualified leads to your team and schedules callbacks. What an AI receptionist does and what it costs in India covers that option in full.
As of October 2026, our Pro plan costs ₹999 + GST a month. It includes 3 hours of talktime a day, with extra talktime at ₹49 + GST an hour, unlimited users and contacts, call recording and history, and an analytics dashboard. Enterprise is quoted individually. You can cancel anytime.
Talk to Our Expert about which fix suits the pattern in your sheet, or write to support@groweasy.ai.
Count and cut your unanswered calls with TalkEasy
Frequently asked questions
Sources
- 1.TRAI, The Indian Telecom Services Performance Indicators, January to March 2026 (released 22 June 2026)
- 2.ACXPA, Abandonment Rate
- 3.411 Locals, SMBs Don't Answer 62% of Phone Calls (18 January 2016)
- 4.TechTarget, How to calculate abandoned call rate for a contact center
- 5.Call Centre Helper, How to Measure Call Abandon Rate
- 6.Call Centre Helper, What Abandoned Call Targets Should we use? (practitioner thread, 2008)
- 7.MetricNet, Short Abandons
- 8.Call Centre Helper, Ofcom removes the abandoned calls 3% safe harbour