
6 companies compared
Call Center KPIs for a Small Indian Team: Start With the Call Log
Call center KPIs for a small Indian team come down to twelve numbers, six for inbound and six for outbound, nearly all computed from the call log, not from the 38-metric lists.

By Tej Pandya, Founder · Updated 31 Oct 2026
On this page
- 01The shortlist
- 02How we ranked them
- 03The companies in detail
- 04How to choose
- 05Key takeaways
- 06What call center KPIs should a small Indian team track first?
- 07Which of the 38 metrics on a typical list can a call log give you?
- 08Why do most scorecards mislead a small team?
- 09What is a good target for each KPI in India?
- 10Which call tools can fill these scorecards, and how do you run the seven-day check on TalkEasy?
- 11Method and sources
- 12Frequently asked
The short answer
A small team needs twelve numbers: six for a shared inbound line and six for outbound calling. Ten of them come straight from the call log, and the other two need an outcome note on each outbound call. Pair each speed number with an outcome number, and set targets from your own baseline.
The shortlist
How we ranked them
- Sold in India
- Suited to a team of about five
- Lists a price
- Lists the reporting it offers
The companies in detail
TalkEasy
Shared-number calling with analytics for small teams
- Listed price
- ₹999 + GST a month for Pro
- Billing
- Cancel anytime
- Reporting
- Analytics dashboard, call recording and history
- Five-person team, a month
- ₹999 + GST
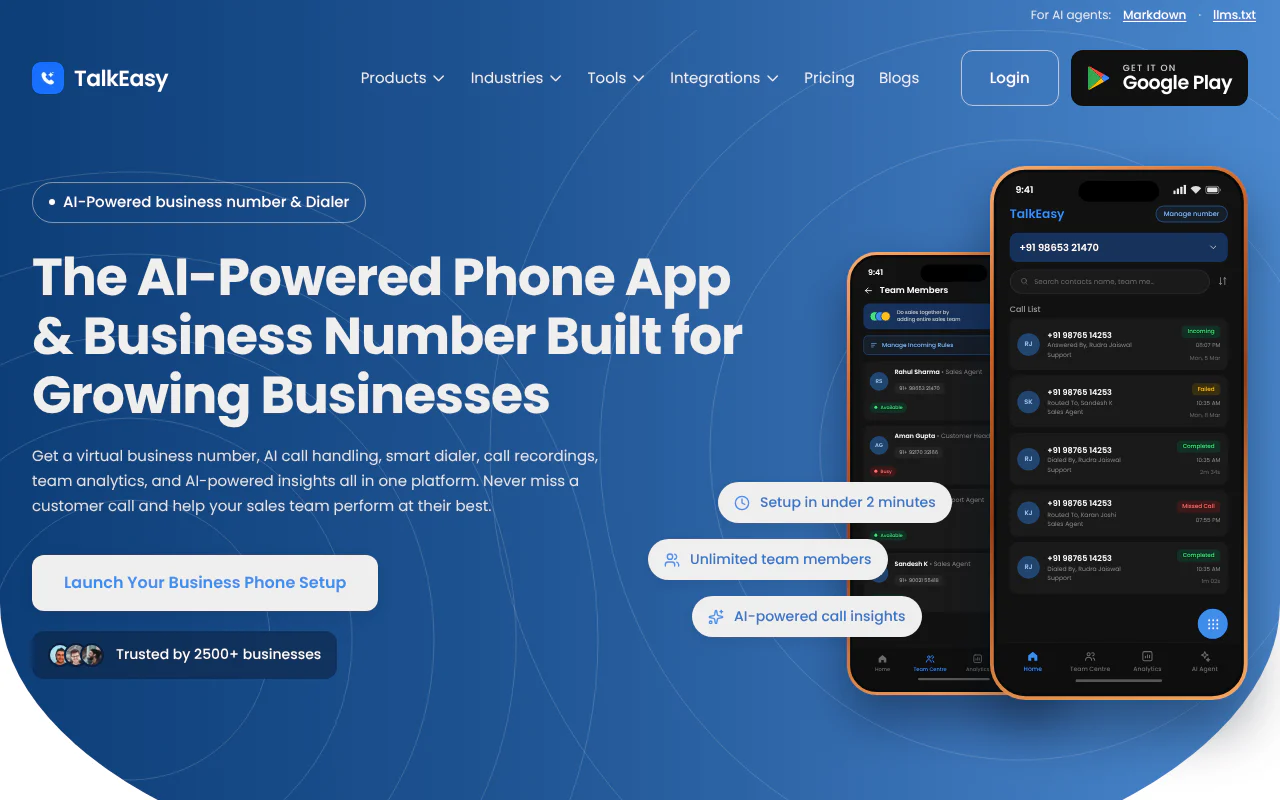
TalkEasy Pro costs ₹999 + GST a month with three talktime hours a day, and extra talktime is ₹49 + GST an hour. Pro includes unlimited users and contacts, call recording and history, team management and the analytics dashboard. The Android app is on Google Play.
Strengths
- Unlimited users and contacts on one plan
- Cancel anytime, with no long-term lock-in
- Analytics dashboard, call recording and history included
MyOperator
Tiered plans priced for 10 users
- Listed price
- Sedan ₹5,000 a month; SUV ₹15,000 a month (10 users)
- Billing
- Yearly commitment, GST extra
- Reporting
- Sedan: basic reports. SUV: real-time dashboards
- Five-person team, a month
- ₹5,000 (Sedan, 10 users)
MyOperator lists Sedan at ₹5,000 a month for 10 users and SUV at ₹15,000 a month for 10 users. Sedan includes basic performance reports and SUV includes real-time dashboards.
Strengths
- Sedan includes basic performance reports
- SUV includes real-time dashboards
- Plans are priced for 10 users
Limitations
- Billing is a yearly commitment with GST extra, so you pay for the year up front
- Pricing is for 10 users, so a five-person team pays the 10-user rate
Callyzer
Call tracking billed per phone number
- Listed price
- Basic ₹175 per phone number a month
- Billing
- Monthly or yearly, taxes extra
- Reporting
- Call tracking, summaries, analysis, status reports
- Five-person team, a month
- ₹875 (5 numbers × ₹175)
Callyzer's Basic plan is ₹175 per phone number a month. It includes call tracking, summaries, analysis, working hours reports and daily status reports.
Strengths
- Lowest five-number cost in the table after TalkEasy
- Billed monthly or yearly
- Working hours and daily status reports
Limitations
- Billing is per phone number, so cost grows with each number added
- Taxes are extra on the listed price
Acefone
Per-user plans with a minimum seat count
- Listed price
- Professional ₹1,599; Ultra ₹1,999 per user a month
- Billing
- Per user
- Reporting
- Recording kept 3 months (Professional), 6 (Ultra)
- Five-person team, a month
- ₹9,594 (6 seats × ₹1,599, the minimum)
Acefone lists Professional at ₹1,599 per user a month (minimum 6 seats) and Ultra at ₹1,999 per user a month (minimum 5 seats). Recordings are kept 3 months on Professional and 6 months on Ultra.
Strengths
- Ultra keeps call recordings for 6 months
- Professional keeps call recordings for 3 months
- Ultra minimum is 5 seats
Limitations
- Professional has a 6-seat minimum, so a five-person team pays for six
- Per-user billing makes it the dearest five-person option in the table
TeleCRM
Per-user calling CRM with a leaderboard
- Listed price
- ₹1,099 quarterly; ₹799 annual, per user a month
- Billing
- Quarterly or annual
- Reporting
- Reports and leaderboard
- Five-person team, a month
- ₹5,495 (5 × ₹1,099, quarterly billing)
TeleCRM is ₹1,099 per user a month billed quarterly, or ₹799 per user a month billed annually. It includes reports and a leaderboard.
Strengths
- Reports and a leaderboard
- Annual billing lowers the rate to ₹799 per user
- Quarterly billing option at ₹1,099 per user a month
Limitations
- Billing is quarterly or annual, so you commit for a term
- Personal SIM calls are not recorded
CallHippo
Per-user plans, with a high-volume Pro Suite
- Listed price
- Pro Suite from ₹1,300 per user a month
- Billing
- Monthly or yearly
- Reporting
- Professional (in dollars): recordings, transcription
- Five-person team, a month
- ₹6,500 (5 × ₹1,300, Bronze)
CallHippo's Pro Suite for high call volume is Bronze ₹1,300, Silver ₹1,900 and Platinum ₹3,200 per user a month. Its other plans are priced in US dollars, from $18 per user a month.
Strengths
- Pro Suite is priced in rupees for high call volume
- Billed monthly or yearly
- Professional plan includes call recordings and transcription
Limitations
- Its other plans are priced in US dollars, so the rupee cost depends on the exchange rate
- No reporting is listed for Pro Suite
How to choose
- 1
Compare how each plan is priced
Prices are not like for like. MyOperator charges for 10 users on a yearly commitment, Callyzer charges per phone number, and Acefone, TeleCRM and CallHippo charge per user. - 2
Work out the five-person monthly cost
Apply each company's listed rate to five people, or to the stated minimum where there is one. - 3
Check the billing term
Note whether you can cancel anytime or must commit quarterly or yearly, and whether GST or taxes are extra. - 4
Treat a reporting name as a claim to test
A named report exists, but whether it gives you callback rate or busy-hour miss share is something to test on a trial with your own numbers. - 5
Check the scorecard against the trial
Take the twelve numbers above and ask each company to show you how many it can produce without exporting to a spreadsheet.
Key takeaways
- Twelve numbers cover a small team: six for the shared inbound line and six for outbound, mostly read straight from the call log.
- Of the 38 metrics on one list, 8 can be computed from a call log alone. The rest need surveys, rotas, ticket tags or other systems.
- Pair each speed number with an outcome number, and take targets from your own baseline.
- One answer-time benchmark Indian businesses can borrow is that of the Telecom Regulatory Authority of India (TRAI) for telecom customer care: 95% of calls answered within 90 seconds.
What call center KPIs should a small Indian team track first?
Track six numbers for a shared inbound line and six for outbound calling. Ten of the twelve come straight from the call log; the other two need an outcome note on each outbound call. Start with these before adding surveys, rota adherence or cost per call, which need people and systems a small team rarely has.
A KPI is a number you track against a target. A missed call is a call that rang and nobody answered.
Scorecard 1: shared inbound line
(table below)
Scorecard 2: outbound calling
| # | KPI | Formula | Source | How to read it |
|---|---|---|---|---|
| 1 | Dials per person per day | Dial attempts ÷ people ÷ days | Call log | Effort only. Sales calls per day shows how to set a realistic number |
| 2 | Connect rate | Answered calls ÷ dials | Call log | Reach. It moves with the list you are calling |
| 3 | Talk time per connection | Talk minutes ÷ connected calls | Call log | Very short connections usually mean a weak opening or a wrong number |
| 4 | Unique reach | Different numbers connected ÷ different numbers dialled | Call log | A low figure means the same numbers are being redialled |
| 5 | Follow-ups kept | Follow-ups called on or before the promised time ÷ follow-ups due | Outcome note with a due date | The discipline number |
| 6 | Outcome rate | Interested or booked ÷ connected calls | Outcome note | See lead conversion rate for choosing the denominator, and call disposition for outcome codes |
What do the numbers look like for one week?
The figures below are an illustrative week we constructed to show the arithmetic. They are not customer data.
| Card | KPI | Working | Result |
|---|---|---|---|
| Inbound | Calls received per day | 520 ÷ 5 days | 104 |
| Inbound | Missed-call rate | 78 missed ÷ 520 | 15.0% |
| Inbound | Callback rate | 41 called back within 30 minutes ÷ 78 | 52.6% |
| Inbound | Average talk time | 1,326 minutes ÷ 442 answered | 3.0 minutes |
| Inbound | Repeat-caller rate | 57 repeat calls ÷ 520 | 11.0% |
| Inbound | Busy-hour miss share | 31 misses in two busiest hours ÷ 78 | 39.7% |
| Outbound (3 callers) | Dials per person per day | 1,500 ÷ 15 person-days | 100 |
| Outbound | Connect rate | 690 connected ÷ 1,500 | 46.0% |
| Outbound | Talk time per connection | 1,380 minutes ÷ 690 | 2.0 minutes |
| Outbound | Unique reach | 640 distinct numbers connected ÷ 1,100 dialled | 58.2% |
| Outbound | Follow-ups kept | 41 kept ÷ 48 due | 85.4% |
| Outbound | Outcome rate | 62 interested ÷ 690 connected | 9.0% |
The reading is simple. Nearly half of the misses (47.4%) were never called back within 30 minutes, and four in ten misses fell in two hours. That points to cover for those two hours and a callback routine, not new hires.
- #
- 1
- KPI
- Calls received per day
- Formula
- Calls ringing the line ÷ days (also per hour)
- Source
- Call log
- How to read it
- Shows when you need people on the phone
- #
- 2
- KPI
- Missed-call rate
- Formula
- Missed calls ÷ calls received
- Source
- Call log
- How to read it
- Each miss is an enquiry lost unless someone rings back. Our call abandonment rate guide covers counting this on a small line
- #
- 3
- KPI
- Callback rate
- Formula
- Missed calls followed by an outbound call to that number within 30 minutes ÷ missed calls
- Source
- Call log
- How to read it
- The 30-minute window is our recommendation; change it to suit your business
- #
- 4
- KPI
- Average talk time
- Formula
- Total talk minutes ÷ answered calls
- Source
- Call log
- How to read it
- Our average call duration guide explains how to read it
- #
- 5
- KPI
- Repeat-caller rate
- Formula
- Calls from numbers that also called in the previous 7 days ÷ calls received
- Source
- Call log
- How to read it
- A rising rate suggests first calls are not settling the matter (our inference)
- #
- 6
- KPI
- Busy-hour miss share
- Formula
- Missed calls in the two busiest hours ÷ all missed calls
- Source
- Call log
- How to read it
- A high share points to a rota problem before a headcount problem (our recommendation)
Which of the 38 metrics on a typical list can a call log give you?
Eight of 38, or 21%, can be computed from a call log alone. Thirteen, or 34%, can be computed if the phone system also records wait or hold time. This is our count, made in October 2026 on the 38 numbered metrics in Zoom's "38 must-know call center metrics and KPIs for 2026" (4 March 2026).
Our method: we put each metric into one group by the data it needs. The test was whether it can be computed from call-log fields (time, direction, answered or missed, duration, person) with no survey, rota, finance or review input. The list counts first contact resolution twice (entries 4 and 24), so we kept both. We counted abandonment as missed ÷ received, which fits a line without a queue.
Outbound calling needs its own scorecard because inbound-only lists miss dials, connects and follow-ups.
Some KPIs come straight from phone-system reports; others need data pulled from several systems. A five-person team has the first kind. Start there.
- Data the metric needs
- Call log only
- Metrics
- Average talk time; calls answered per hour; missed and declined calls; calls handled; call arrival rate; call abandonment rate (missed ÷ received on one line); repeat call rate; callback rate
- Count
- 8
- Data the metric needs
- Wait or hold timestamps
- Metrics
- Average hold time; service level rate; average first response time; average speed of answer; active waiting calls
- Count
- 5
- Data the metric needs
- Customer or staff surveys
- Metrics
- Customer satisfaction score (CSAT); Net Promoter Score (NPS); customer effort score; agent effort score; employee satisfaction
- Count
- 5
- Data the metric needs
- A person reviewing recordings
- Metrics
- Quality assurance (QA) scores
- Count
- 1
- Data the metric needs
- An outcome tag or ticket
- Metrics
- First contact resolution (listed twice); average resolution time; average age of query
- Count
- 4
- Data the metric needs
- Rota, login or HR records
- Metrics
- Adherence to schedule; call availability; agent utilisation rate; agent turnover rate
- Count
- 4
- Data the metric needs
- Tags or after-call-work timing
- Metrics
- Types of calls handled; call transfer rate; average handle time (AHT); wrap-up time
- Count
- 4
- Data the metric needs
- Carrier or finance data
- Metrics
- Percentage of calls blocked; cost per call
- Count
- 2
- Data the metric needs
- A bot
- Metrics
- Bot containment; AI adherence; agent AI feedback; escalation rate; intent recognition accuracy
- Count
- 5
- Data the metric needs
- **Total**
- Metrics
- Count
- **38**
Why do most scorecards mislead a small team?
Most scorecards reward speed without outcome and borrow targets from other businesses. Both errors push a small team toward activity that looks good on a report and changes nothing in sales or service.
Take two outbound callers on one day (illustrative figures):
| Caller | Dials | Connected | Connect rate | Interested | Outcome rate |
|---|---|---|---|---|---|
| A | 160 | 40 | 25.0% | 6 | 15.0% |
| B | 90 | 45 | 50.0% | 9 | 20.0% |
Caller A makes 78% more dials than B. Caller B produces 50% more interested people. A scorecard with only dials ranks them the wrong way round. That is why every speed number in the scorecards above sits beside an outcome number.
The same pairing works inbound. A falling talk time with a rising repeat-caller rate usually means calls are being cut short and customers are ringing back. This is our inference, and the repeat-caller rate lets you test it with your own data.
The second error is the borrowed target. A connect rate depends on the list: people who enquired behave differently from people on a purchased list. We recommend one baseline per list type, taken from your own previous week.
What is a good target for each KPI in India?
One answer-time benchmark Indian businesses can borrow is TRAI's for telecom customer care: at least 95% of calls answered, voice to voice, within 90 seconds. Every other target on your scorecard comes from your own baseline.
TRAI's performance report for January to March 2026, published on 22 June 2026, lists this benchmark next to a separate one: accessibility of the call centre or customer care, at least 95%. The report also shows how operators did:
- Wireless operators met the 90-second benchmark in all 88 operator-and-area reports in both February and March 2026.
- For wireline, 6 of 85 reports (7.06%) for the quarter ending March 2026 missed it. All six were Bharat Sanchar Nigam Limited (BSNL), the state-run operator, service areas, at between 73.97% and 82.88%.
This benchmark covers telecom operators' customer care only. It does not bind your business. As a reference we would aim for 95% of calls answered, a missed-call rate of 5% or less. This aim is looser than TRAI's on timing, because it counts a call answered at any point, and stricter on coverage, because it counts every call that rings the line, not only calls that reach a customer-care agent. Treat it as our recommended aim. The illustrative inbound week above, at 85.0% answered, would fall short of it.
Queue-based centres also use a service level. An 80/20 service level means 80% of calls are answered within 20 seconds. In the International Customer Management Institute (ICMI) model of 100 calls in half an hour, 180 seconds of talk time and 30 seconds of after-call work, an 80/20 target leaves about 30% of callers waiting in a queue, with an average speed of answer (the average wait before pickup) of about 10 to 15 seconds. That model is from ICMI's 2002 to 2003 tutorial and suits centres with a queue. On a shared line with a few people, the missed-call and callback rates are easier to measure and act on.
For every other KPI, our recommendation is to set the target at your seven-day baseline plus about 10% of that baseline (a 46% connect rate becomes about 50.6%), and to keep the target until you hit it two weeks running. This is our rule, not an official figure. Apply it by type of KPI:
- Higher is better (callback rate, connect rate, unique reach, follow-ups kept, outcome rate): baseline plus 10% of the baseline. In the illustrative week, a 52.6% callback rate becomes about 57.9%.
- Lower is better (missed-call rate, repeat-caller rate, busy-hour miss share): baseline minus 10% of the baseline. A 15.0% missed-call rate becomes 13.5%.
- Volume and time (calls received per day, dials per person per day, average talk time, talk time per connection): no target. Track them to plan cover and to read the other numbers.
Move one number at a time.
Which call tools can fill these scorecards, and how do you run the seven-day check on TalkEasy?
Eight options are worth a look for a team of about five: TalkEasy and seven others. They differ mainly in what they charge and how they bill. Prices are as of 31 October 2026. Two of the eight are not ranked because they publish no price: Exotel directs buyers to talk to sales, and Runo shows the right price once you choose country, telephony and plan, with a 10-day free trial and AI call intelligence. Check every price on the company's own site before you buy.
Read the comparison with three points in mind:
- Prices are not like for like. MyOperator charges for 10 users on a yearly commitment, Callyzer charges per phone number, and Acefone, TeleCRM and CallHippo charge per user. Our five-person column applies each company's listed rate to five people, or to the stated minimum where there is one.
- A reporting name is not a KPI. A named report exists, but whether it gives you callback rate or busy-hour miss share is something to test on a trial with your own numbers.
- Check the scorecard against the trial. Take the twelve numbers above and ask each company to show you how many it can produce without exporting to a spreadsheet.
How do you run the seven-day KPI check on TalkEasy?
Put every team call through one number and one dialer for seven days, read the report, and fill both scorecards. On TalkEasy this takes five steps, and the log fills itself.
- Route all calls through one place. Use the shared business number for inbound and the Business Dialer for outbound. The dialer logs every call automatically with the contact, time, duration and outcome.
- Open Sales Call Analytics. It reports total calls (incoming and outgoing), answer rate, missed calls, average talk time, team performance and peak hours, and the reports can be downloaded. That covers inbound numbers 1, 2 and 4 and outbound numbers 1 to 3. Work out inbound 6, inbound 3, inbound 5 and outbound 4 from the downloaded call history.
- Count callbacks and repeat callers from the shared call history. Everyone on the number sees the same history and recordings through Team Collaboration, so one person can do this in a spreadsheet.
- Record the outcome and the follow-up due date in the call note. Do this for each outbound call, using a short code list (call disposition has ten).
- Fill the cards and pick one number to move. Then repeat next week. Sales team productivity shows a wider seven-day audit.
Two features help the numbers move.
Missed Call Automation is designed to call customers back automatically after a missed call, which is aimed squarely at the callback rate.
- Strength: it reconnects with missed callers automatically, so a missed enquiry is not left waiting for someone to notice it.
- Strength: it needs no manual effort once enabled. Nobody has to keep a list of numbers to ring back.
- Strength: callbacks trigger on your own routing and availability rules, so you decide who and when.
- Limitation: it acts after a call is missed. It lowers the cost of a miss, but the missed-call rate and the busy-hour miss share still need cover in the busy hours (our reading).
- Limitation: callbacks follow the routing and availability rules you set, so they are only as good as those rules. Check the rules before relying on the callback rate it produces.
AI Call Insights reads recordings and flags objections, competitor mentions, buying intent, pricing discussions, follow-up commitments and compliance issues, so a manager can pick which calls to listen to.
- Strength: it reads every recording and transcript, which a manager with a full day cannot do.
- Strength: it flags six kinds of moment, which lets a manager review flagged moments instead of whole calls.
- Strength: the flags on follow-up commitments give you a way to check the follow-ups-kept number against what was said on the call.
- Limitation: it works on recordings and transcripts, so it reads only recorded calls. TalkEasy plays an announcement at the start of every recorded call, which callers hear.
- Limitation: recordings are stored encrypted with access limited to the admins you choose, so a manager outside that group cannot review the flagged calls. A flag points to a moment, and a person still has to listen and judge it (our view).
As of October 2026, TalkEasy Pro costs ₹999 + GST a month with three talktime hours a day, and extra talktime is ₹49 + GST an hour. Pro includes unlimited users and contacts, call recording and history, team management and the analytics dashboard. You can cancel anytime, with no long-term lock-in. The Android app is on Google Play.
How we built this list
We looked at eight call tools sold in India for a team of about five, using prices as of 31 October 2026. Companies were included if they are sold in India and suit a small team; Exotel and Runo publish no price and are described in the sections rather than ranked. TalkEasy is ranked first and is one of the companies listed. Rankings are as of October 2026.
This page is published by TalkEasy. If anything here is out of date, tell us and we will correct it.
Sources
- 1.TRAI, The Indian Telecom Services Performance Indicators, January to March 2026, Telecom Regulatory Authority of India, 22 June 2026
- 2.ICMI, Call Center Metrics: Key Performance Indicators (tutorial TU00002), ICMI, 2002 to 2003
- 3.TalkEasy Sales Call Analytics, TalkEasy
- 4.TalkEasy Business Dialer, TalkEasy
- 5.TalkEasy, TalkEasy, October 2026
Related pages
Frequently asked
Run the KPI scorecard on your own call numbers
Use Talk to Our Expert at talk.groweasy.ai or write to support@groweasy.ai to run the scorecard on your own numbers.