Lead Conversion Rate: Formula, Denominators and a Funnel Sheet
Lead conversion rate is customers won divided by all leads received in a period. State the denominator every time, then split the funnel into stages to find where leads are lost.

By Tej Pandya, Founder · Updated 14 Oct 2026

Key takeaways
- Quote lead conversion rate as customers won divided by all leads received in one period, and say "of all leads" every time you give the number.
- One set of 1,000 leads can honestly produce 2.0%, 4.4% or 13.3%, depending on the denominator (our worked example below).
- The headline rate is the product of the rates at each funnel step, so the weakest step is where to work. For phone-led teams that is often the step where the lead is reached.
- Judge your rate against your own earlier results, split by lead source. A published figure helps only when it names its denominator, country and industry.
In this article
- 1What is lead conversion rate, and which formula should you quote?
- 2Why can the same leads give a 2%, 4.4% or 13.3% conversion rate?
- 3Is your lead conversion rate good? How to judge it without a benchmark
- 4How do you find which stage of the funnel is losing your leads?
- 5How fast should you call a new lead, and how often should you retry?
- 6How does TalkEasy help you measure and raise the reached step?
- 7How do you run the funnel sheet in seven days?
- 8Frequently asked questions
The conversion rate most people want is not the one most reports give. In First Page Sage's 2026 benchmark report for B2B software, built on client data from 2017 to 2025, 39% of leads become marketing qualified leads (MQLs), the leads marketing judges ready for sales. That is a genuine conversion rate, but it is not the share of leads that become customers.
Every funnel holds several conversion rates, and one set of leads can produce a high figure or a low one depending on what you divide by. Owners who buy leads from portals, ads or referrals then compare their number with a figure counted another way, and fix the wrong step.
This page gives you one formula to quote, a worked example in which one set of leads yields three different rates, and a funnel sheet that shows where leads are lost. For teams that sell by phone, the answer is often in the first step: whether the lead was reached at all.
What is lead conversion rate, and which formula should you quote?
Lead conversion rate = customers won ÷ all leads received in the same period × 100. A lead is anyone who gave you contact details and could plausibly buy. A customer won is a lead that has paid within your closing window, the time you allow a lead to buy before you stop counting.
Group leads by the month they arrived (a cohort) because buying takes weeks. If you divide this month's customers won by this month's leads, you mix buyers from old enquiries with leads still in progress. Set a closing window that matches your sales cycle, and wait for it to pass before you report the cohort. For illustration (our assumption, not an industry figure): 30 days for a clinic consultation, 60 to 90 days for property.
Say what counts as converted, because every funnel step has its own rate. First Page Sage's 2026 B2B software data gives 39% from lead to MQL, 38% from MQL to SQL (a sales qualified lead, one that sales has accepted), 42% from SQL to opportunity (a qualified deal sales is actively pursuing) and 37% from opportunity to customer won. Multiplying them, 0.39 × 0.38 × 0.42 × 0.37 = 0.023, so about 2.3% of leads become customers won (our calculation from those four published rates, which cover B2B software only).
Salesforce's State of Sales 2026 report shows how the label changes the answer. Its AI sales agents contacted 1,30,000 leads and created 3,200 opportunities in four months. That is 3,200 ÷ 1,30,000 = 2.46% (our calculation), a lead-to-opportunity rate, not a lead-to-customer-won rate. Write yours the same way: "2% of all leads became customers won within 60 days."
Why can the same leads give a 2%, 4.4% or 13.3% conversion rate?
The same leads give different rates because each rate divides by a different group, called the denominator. In this illustration (our model, not market data), a business received 1,000 leads in a month, reached 450 of them, qualified 150, and won 20 customers.
| Denominator | Calculation | Rate |
|---|---|---|
| All leads received | 20 ÷ 1,000 | 2.0% |
| Leads reached (spoken to) | 20 ÷ 450 | 4.4% |
| Qualified leads (need and budget confirmed) | 20 ÷ 150 | 13.3% |
All three are arithmetically correct, and they answer different questions. The first tells you what your lead spend and calling effort produce. The second and third tell you how well you close once a conversation happens. Quote the first one externally, since it is the hardest to flatter, and use the others inside the team to find problems.
Is your lead conversion rate good? How to judge it without a benchmark
Judge your rate against your own earlier cohorts, split by lead source, because published figures count different things. Two examples show the gap: about 2.3% of B2B software leads become customers won (calculated above), while Invoca's 2025 benchmark found 37% of phone leads converting during the call, across more than 60 million calls in nine industries. Neither is wrong, and they are more than ten times apart.
Before using any outside number, ask what it divided by, which lead source it covers and which country and product it describes. This is our recommendation. Referral, portal and ad leads behave differently, so a blended rate moves whenever your source mix moves, even if your team has not changed. Keep one line per source and review every four to six weeks.
Treat small cohorts with care. With 100 leads, one extra customer won moves the rate by a full percentage point.
How do you find which stage of the funnel is losing your leads?
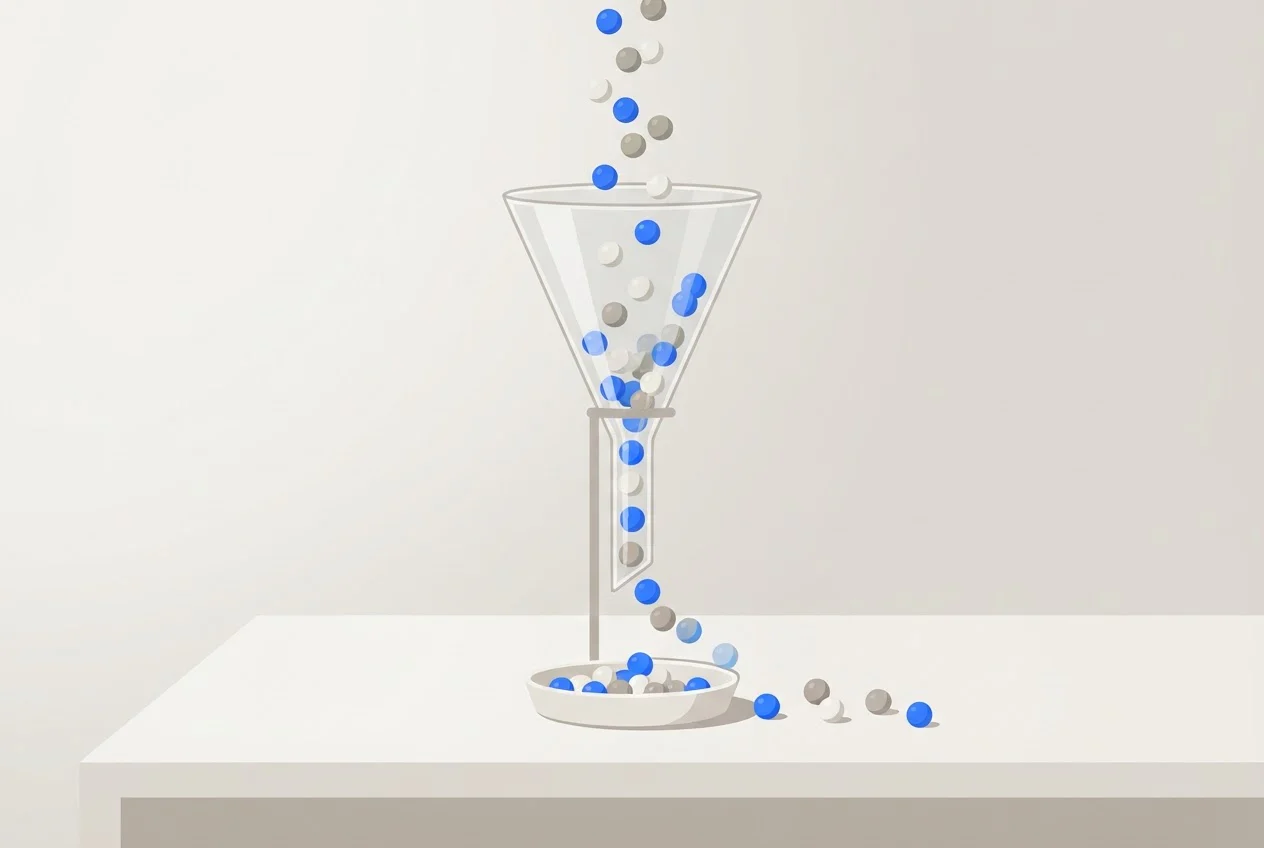
Find the leaking stage by dividing each step by the one before it. The headline rate equals the product of these stage rates, so the step that has fallen furthest against your earlier results is where to work first.
Use this sheet for one cohort. The example column continues the 1,000-lead illustration above.
| Step | What to count | Example | Rate vs previous step |
|---|---|---|---|
| A. Leads received | Every enquiry in the month, duplicates removed, all sources | 1,000 | n/a |
| B. Reached | Leads with at least one conversation or a reply | 450 | 45.0% |
| C. Qualified | Reached leads that confirmed need and budget (write your own one-line test) | 150 | 33.3% |
| D. Next step done | Visit, demo, consultation or accepted quote | 60 | 40.0% |
| E. Customers won | Leads that paid within your closing window | 20 | 33.3% |
Headline: E ÷ A | 2.0% |
Check the working: 0.45 × 0.333 × 0.40 × 0.333 = 0.02, which is 2.0%. The headline must equal the product of the four stage rates. A mismatch means a lead was counted twice or skipped.
Read the sheet with these tests:
- Fail: B ÷ A has fallen against your last cohort from the same source. Fix reaching leads before anything else, because a better pitch cannot help a lead you never spoke to.
- Rule of thumb (ours, not a benchmark): if B ÷ A is below 50% on a source you phone, start with reaching. The 45% in the example would fail this test.
- Fail: C ÷ B is falling while B ÷ A holds steady. Your lead source has got worse, or your qualified test has loosened.
- Fail: D ÷ C has fallen. The next step is too hard to book, so offer a specific slot on the same call.
- Pass: a step matches or beats your last cohort from the same source.
Record each call's result in the same words every time. Our guide to call disposition codes lists outcome labels you can reuse, so steps B and C come from the call log and not from memory.
How fast should you call a new lead, and how often should you retry?
Call within an hour of the enquiry, and sooner if you can. In a Harvard Business Review study of 2,241 US companies that received a test web enquiry, firms that responded within an hour were nearly seven times as likely to qualify the lead as firms that responded an hour later, and more than 60 times as likely as firms that took 24 hours or longer (Oldroyd, McElheran and Elkington, HBR, March 2011). The scope is US web enquiries in 2011, so read it as evidence that delay costs leads, not as a promise for Indian phone leads.
Our recommendation for retries: make a second attempt the same day at a different hour, and a third the next day, then stop. Place the retries in the hours when most of your calls are answered, which your peak calling hours report shows. Our pages on lead response time and follow-up call scripts cover the first call and the retries in detail.
The arithmetic of reaching leads is simple, and you can run it on your own numbers:
- Dials needed = conversations wanted ÷ answer rate. At a 50% answer rate, 100 conversations need 200 dials (100 ÷ 0.50). At 40%, they need 250 dials (100 ÷ 0.40).
- One attempt per lead caps step B at your answer rate. A team whose calls are answered half the time cannot reach more than about half its leads on a single try.
- If each attempt connected independently 50% of the time, three attempts would reach 87.5% of leads (1 − 0.5³ = 0.875). Real attempts are not independent, so this is an optimistic illustration (our model), but it shows why repeat calls matter.

How does TalkEasy help you measure and raise the reached step?
Our Sales Call Analytics gives you answer rate, missed calls, talk time and peak hours, which feed the reached step. Call notes and AI Call Insights help you judge the qualified step. Visits, demos and customers won you record yourself from your CRM (customer relationship management software) or invoices.
Reports run daily and monthly, and you can download them. The answer rate is the input for the dials formula above, and peak hours tell you when to schedule retries. Our Missed Call Automation is designed to call the customer back automatically after a missed call, so a retry no longer depends on someone remembering.
Every call made through our Business Dialer is logged with the contact, time, duration and outcome, and you can add a note to the call. AI Call Insights flags buying intent, objections, pricing discussions and follow-up commitments in recorded calls. Recordings begin with an announcement to the caller.
As of October 2026, our Pro plan costs ₹999 + GST (goods and services tax) a month with three hours of talktime a day, and extra talktime is ₹49 + GST an hour. Paid plans include unlimited users and contacts, and you can cancel anytime. To see how your team's calls would map onto this sheet, talk to our expert.
How do you run the funnel sheet in seven days?
Run it in seven days by fixing definitions first, then counting a past cohort, then changing one thing. Do not change two steps at once, or you cannot tell which change worked.
- Day 1: write four one-line definitions.These are lead, reached, qualified and customer won. Pass: two people classify the same five sample leads identically.
- Day 2: choose the cohort.Take the leads received in a month that ended at least one closing window ago, and remove duplicates. Pass: the count in step A matches the rows in your list.
- Days 3 and 4: fill steps B to D.Use the call log and call notes. Pass: every lead has a first-attempt time and an outcome.
- Day 5: fill step E from invoices.Pass: customers won in the sheet match payments received.
- Day 6: calculate the stage rates.Pass: their product equals E ÷ A. Name the weakest step.
- Day 7: pick one change for that step.
For example, a second call attempt at your busiest answer hour. Rerun the sheet on the next cohort. Our guide to tracking your sales team's calls lists the call metrics to review weekly.
See which step of your funnel is losing leads
Frequently asked questions
Sources
- 1.Sales Funnel Conversion Rate Benchmarks: 2026 Report, First Page Sage
- 2.Salesforce Announces State of Sales Report for 2026
- 3.Invoca Call Conversion Benchmark Report press release, June 2025
- 4.The Short Life of Online Sales Leads, Harvard Business Review, March 2011
- 5.TalkEasy Sales Call Analytics
- 6.TalkEasy Business Dialer
- 7.TalkEasy Missed Call Automation
- 8.TalkEasy AI Call Insights